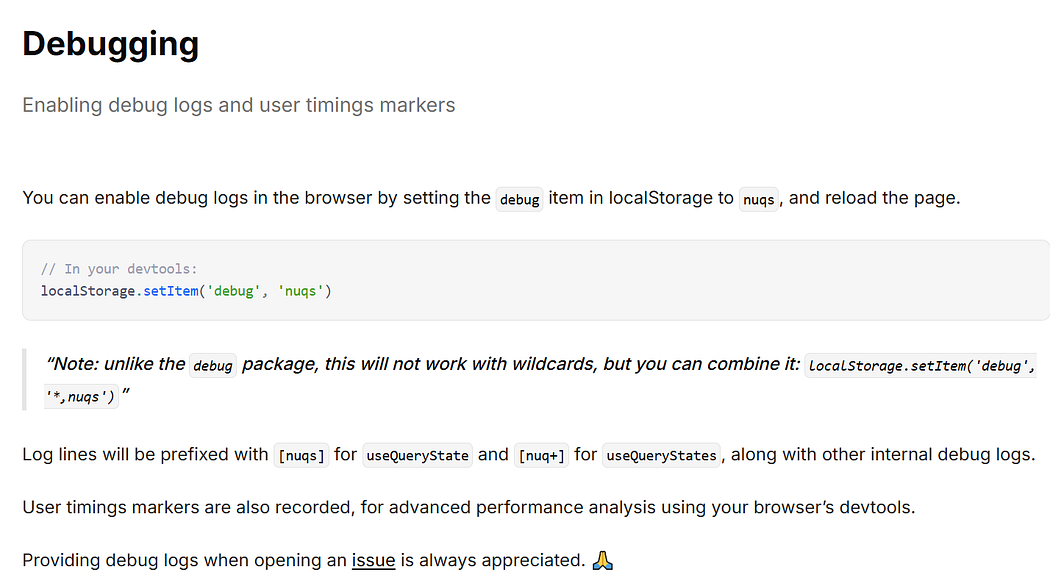
In the nuqs documentation about the debugging, you can enable debug logs by setting the debug item in local storage to nuqs and reload the page, you could just open your browser console, that is, the dev tools and run this code below
//In your devtools:localStorage.setItem('debug', 'nuqs')
what it does is, it will set the key as “debug” and the value as the nuqs and this is something you could find in the local storage.
Log lines will be prefixed with [nuqs] for useQueryState and [nuqs+] for along with other internal debug logs.
//In your devtools:localStorage.setItem('debug', 'nuqs')
import type { Options } from './defs'import { error } from './errors'import { getDefaultThrottle } from './utils'export const FLUSH_RATE_LIMIT_MS = getDefaultThrottle()type UpdateMap = Map<string, string | null>const updateQueue: UpdateMap = new Map()const queueOptions: Required< Omit<Options, 'startTransition' | 'clearOnDefault'>> = { history: 'replace', scroll: false,
Once you have the debug mode enabled, obviously you will have to call this debug function in your codebase, so the way nuqs has this return or declared is that you will find the debug function in a file called debug.js that’s in nuqs package.
Debug function accepts two parameters, the first one is the message and the next one is,, its this spread operator so basically that means that it can accept n number of parameters.
 if (!debugEnabled) {
    return
  }
At line number 7, you will see this function called sprintf it’s written in the same file. It does some operation using a regular expression but you have to remember that, all it does is, it returns a string. Now, this string could either be stringify or just a plane string depending on a matching condition as shown below:
performance.mark — there is another article where I wrote about performance.mark. Learn more about performance
Debug? what it does is, it just simply logs the message as you can see at line number 11.
console.log(message, ...args)
Along with the args that were passed to the debug function get logged, so all the parameters that are sent to the debug function basically get logged using console.log and if there is an error in logging, the error is passed and the message gets logged based on the string return by this sprintf.
try { // Handle React Devtools not being able to console.log('%s', null) console.log(message, ...args) } catch (error) { console.log(msg) }}
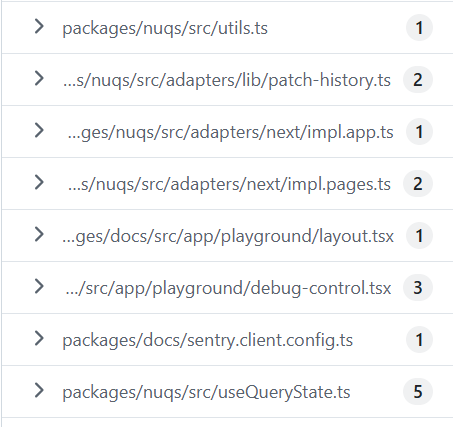
This debug function is used in a lot of places across the nuqs codebase.
Here’s is one example picked from patch-history.ts. At line no 61, debug function gets called with the message and n number of args so that all of this get logged when the debug mode is enabled
debug(
    '[nuqs %s] Patching history (%s adapter)',
    '0.0.0-inject-version-here',
    adapter
  )
Here is another example where the debug function is called and this is from useQueryState.ts file at line no 250, you will find that debug function is called with this message and then it also has two additional parameters